Analyzing and Predicting CVD Events
Imagine you are doing an internship in the data analytics team of a small health insurer with a portfolio of about 5000 insurees. In the recent past, the health insurer observed an increasing number of serious cardiovascular disease (CVD) incidences (e.g. strokes, myocardial infarctions, etc.). For that reason, the senior executives of the health insurer want to offer high risk individuals in their portfolio the participation in a lifestyle change and sports program. The executives asked your supervisor, the head of data analytics, to identify high risk individuals in the portfolio.
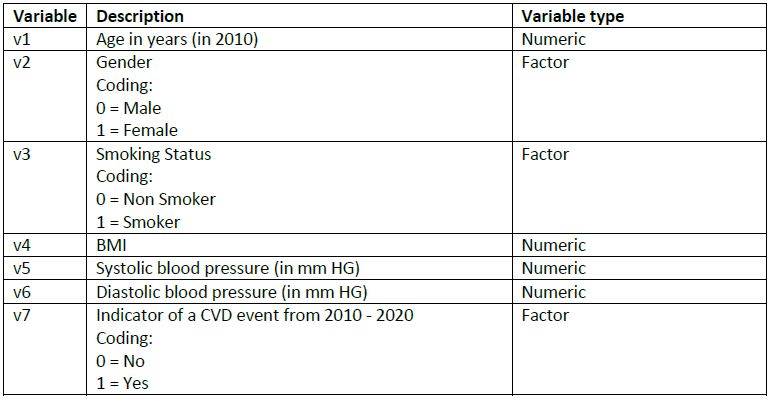
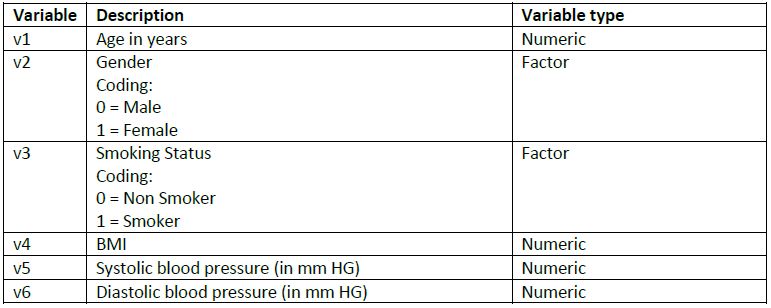
Since your supervisor is always very busy, she assigned you to do this analytics project. All she did by herself so far was to acquire two datasets that are necessary for doing the project. The first dataset was acquired from an external data provider. This dataset contains data for 10.000 individuals and includes information on individual characteristics (e.g. gender, bmi,…) measured in 2010 and information on which of these individuals experienced a CVD event in the following 10 years. The second dataset includes all 5000 insurees in the health insurer’s portfolio. This dataset only includes information on individual characteristics which were measured just recently. To explain you the specific tasks and to tell you her expectations, she scheduled a short meeting with you. Before the meeting took place, she sent you an email with two csv-files that contain the data and two codebooks:
Dataset 1: SSRC_dataset_case_study_1.csv
Dataset 2: SSRC_dataset_case_study_2.csv
In your meeting your supervisor told you to complete the following 6 Tasks:
1. Data preparation
Load the dataset and prepare it for the analysis
Assign meaningful names to datasets, variables and factor levels
Create a variable that indicates whether an individual has hypertension (systolic bp >= 140 and/or diastolic bp >= 90) -> focus on this indicator instead of the numeric bp variables in the subsequent analysis.
2. Data exploration
Analyze the distributions of each variable in dataset 1 by using an adequate graph.
Analyze the relationship between the outcome variable (CVD Event) and each of the numerical variables graphically.
3. Regression analysis
- Use a logit model to analyze the relationship between individual characteristics and the 10 year probability of a CVD event.
4. Identification of high risks in the portfolio
Use the logit model results to estimate the 10 year probability of a CVD event in the portfolio of the health insurer.
Create a variable that indicates whether the estimated probability is above 10% and label those individuals as “high risk” individuals.
5. Expectations regarding the number of CVD Events in the upcoming 10 years
Based on the probabilities you estimated before, you are supposed to calculate the expected number of CVD events in the portfolio by simply summing up those probabilities.
Your supervisor is also interested in the uncertainty that might be connected to the estimated number of CVD events in the portfolio. Hence, she wants you to use the bootstrap method to get an impression in which interval this number might lie with high probability. [Hint: Sample 1000 times with replacement from the dataset that is used to fit the logit model)
6. Risk classification tool
You are supposed to write an easy to use R function that takes the variables V1 – V6 as inputs. The output of the function should say “Offer Life Style Change Program” if a new applicant features a 10 year probability of a CVD event above 10 % and “No Action Needed” otherwise.
You are also supposed to showcase that your function works for both low and high risk individuals.
Your supervisor asks you to document all analysis steps and the respective results by means of a well structured R Markdown document.
Have Fun!